Enhancing PI Systems with Compression MD
In the world of data management and system efficiency, Compression MD stands out as a revolutionary tool. Developed by InCentrik, Compression MD...
.svg)

3 min read
.png)
Whether your business is in manufacturing, distribution, or even lithium mining, it is safe to say that your company probably has some type of maintenance plan in place, and this maintenance plan is likely preventive in nature.
But, what if technicians could visualize real-time machine operation data to identify emerging issues before these interrupt operations?
With predictive maintenance, repairs happen during machine operation and address an actual problem. If a shutdown is required, repairs will be shorter and more targeted.
You’re most likely familiar with preventive maintenance. The theory behind preventive maintenance is to take regular steps to prevent problems before they occur.
Predictive maintenance is a growing field with options for connectivity and data collection continuing to be developed. Like preventive maintenance, it is a proactive approach.
The main difference between preventive and predictive maintenance is that predictive maintenance uses condition-monitoring equipment to assess the performance of assets through a more real-time, data-driven approach, therefore, identifying the potential for issues before they occur.
Automobile Oil Change
Preventative: Following the specified mileage from the car's manufacturer
Predictive: Understanding the stress on the car's engine (i.e. highway miles vs. city miles) and how this affects time for an oil change.
Cost Savings: Following a predictive approach saves money
Motor Belt Change
Preventative: Changing the belt after the motor runs for 100 hours.
Predictive: Following trends of slippage to know when is the best time to change out the motor's belt, whether it is before or after 100 run hours.
Cost Savings: Following a predictive approach saves money by changing the motor's belt prior to failure.
What good is data if you can't see it?
Yes, having raw data is extremely valuable, but transforming that raw data into a usable format is key.
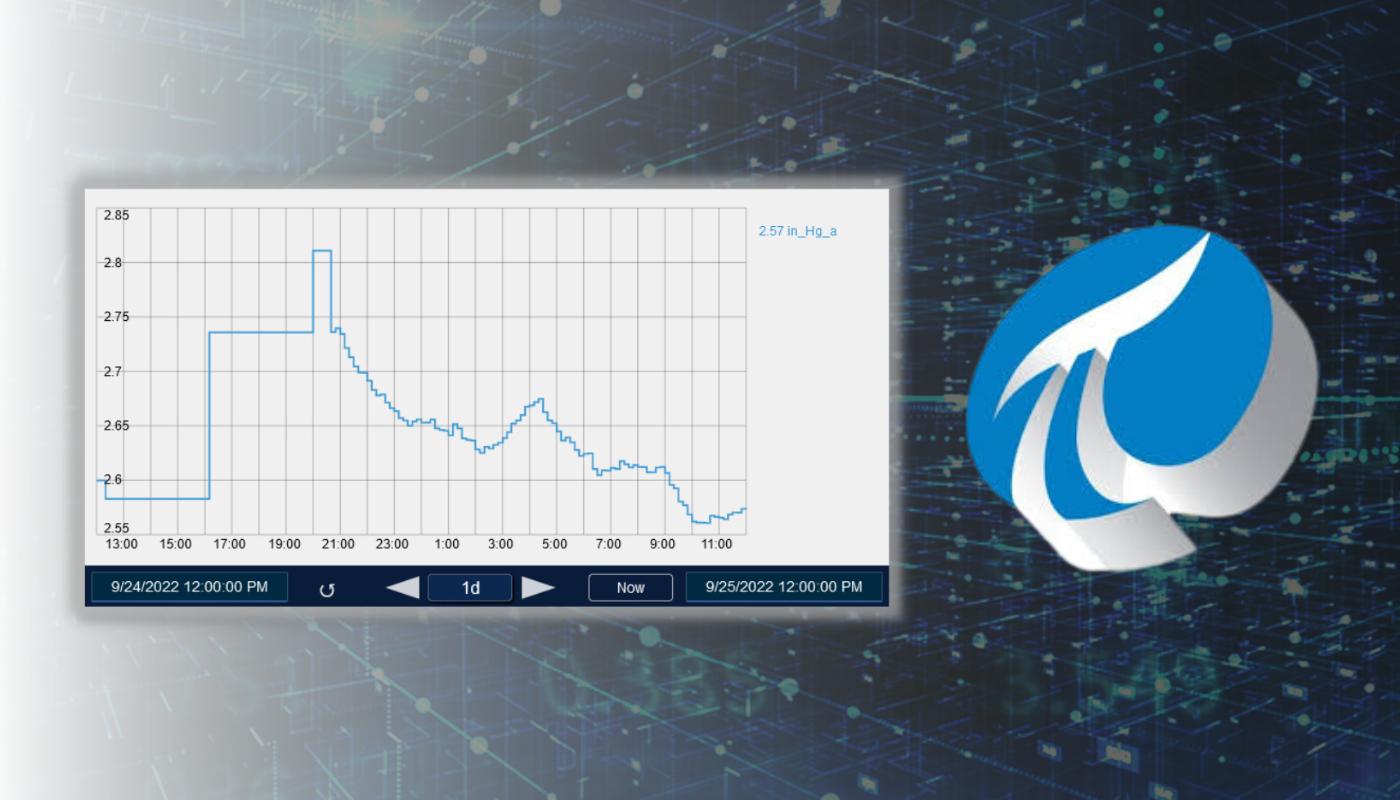
With PI Vision, information can quickly become consumable by allowing users to organize and visualize data in an easy-to-read format. Having a "Visual At A Glance" data approach enables predictive maintenance and drives organizations to make better data-driven decisions.
When it comes to visualizing data, Skylabs and PI Vision have your back.
PI Vision is a visualization tool used quickly, easily and securely access PI System data. With PI Vision users can analyze data in multiple ways, on any device.
PI Vision is OSIsoft’s flagship data visualization tool that enables all levels of an organization to gain insight into their critical operations and processes in real-time. It’s an easy-to-use, self-service, and scalable visualization tool that provides benefits across an entire organization.
You may be familiar with PI Processbook, a tool which simplifies data visualization that helps users access and visualize their PI Server data through interactive and graphical displays which can be populated with live data, historical data, or predictive data.
OSISoft announced that they will no longer provide support for Processbook starting in 2022, so migration to PI Vision will be necessary.
Don't worry, Skylabs provides a roadmap for migration, expediting your migration with simplicity and precision, click below to learn more.

Easy PI works with SmartHub to simplify data input for anyone using PI, allowing the user to skip spreadsheets and custom VBA scripts.
With Easy PI, your data is securely managed and transferred over the cloud and can be inputted remotely with mobile devices.
Users do not have to use PI System Explorer with SmartHub, learn more by clicking below.

It’s easier to manage what you can see. Bring operations data to life with innovative, easy-to-use visualization tools. Get data into the hands of operators, engineers, analysts, and reporting teams across your organization.
PI Vision grants users with the right tools and empowers them to find savings and improvement opportunities.
As an OSIsoft System Integrator Partner, Skylabs is enabled to build:
Build new PI System applications on OCS—OSIsoft's scalable, multi-tenant cloud database platform as a service.
Use our developer technologies to build custom applications and integrate PI System data with reporting and analytics platforms, geospatial and maintenance systems, and more.
Use the PI System’s latest technology to build applications that run at the edge. Send data from remote locations to PI Core or PI Cloud.
As an OSIsoft System Integrator Partner, Skylabs delivers solutions to many industries, including:
Skylabs experts facilitate custom solutions with OSIsoft's PI Vision. By partnering, our team of engineers can harness diagnostic and predictive analytics to enable greater operational efficiency and deeper insight.
Contact us today to get started.

In the world of data management and system efficiency, Compression MD stands out as a revolutionary tool. Developed by InCentrik, Compression MD...

In the realm of industrial automation and data management, AVEVA's PI System (formerly OSIsoft's PI System) stands out as a pivotal technology. As...
.png)
In today's data-driven world, the ability to visualize and interact with complex datasets is crucial for informed decision-making. PI Vision, a...